Draw the Extended Matrix in yEd
Note
This how-to is adapted from Exercise 2 — Draw an Extended Matrix in the
Reconstructive Archaeology handbook. The reference dataset folder is
M2E.
Note
Prerequisite: the Extended Matrix palette must be installed in yEd before you can draw the matrix. See Set up the yEd palette for the one-time setup.
In this exercise we will draw the stratigraphic units inside an Extended
Matrix using yEd and the EM palette. By the end you will have a small
.graphml file ready to feed into the downstream tools of the EM
ecosystem (typically EM Tools in Blender).
Prerequisites
yEd Graph Editor installed (free download from yWorks).
The Extended Matrix palette for yEd installed (menu Edit → Manage Palette → Import Section; a short walkthrough is available on the EM YouTube channel).
The workspace folder of your project prepared — see EM workspace preparation.
Step 1: prepare the canvas
By means of drag & drop you take from the EM template (visible in the right side of the yEd window) a canvas — a blue-coloured swimlane on which the matrix will be written — and add it to the workspace.
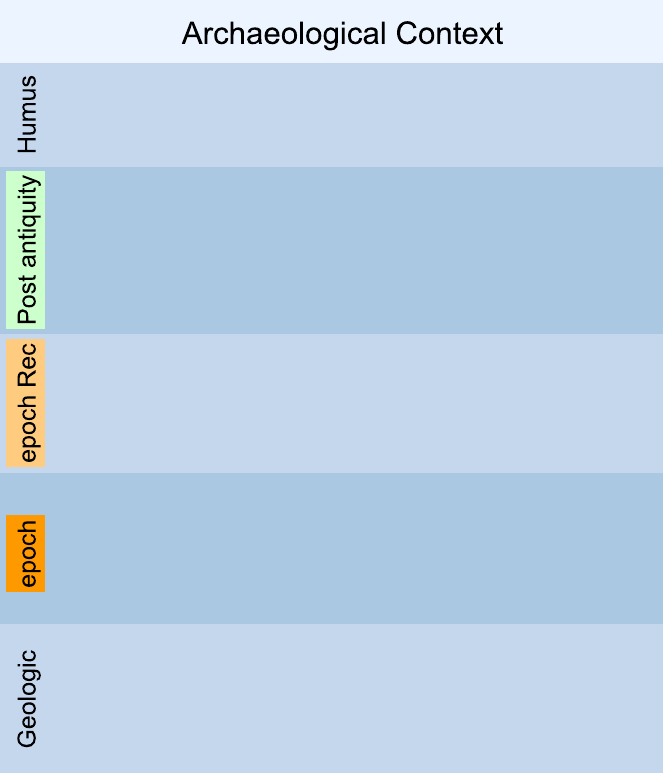
Fig. 1 Empty Extended Matrix canvas inside yEd (these objects in yEd are called swimlanes).
Rename the top of the canvas (its default label is Archaeological
Context) with the name of the context under study.
The canvas comes pre-populated with a number of preset epochs. Rename them
as needed. For each epoch you intend to reconstruct, add immediately
above the corresponding observational epoch a reconstructive epoch:
its name should match the observational one with the suffix rec
appended — for example 1st century AD → 1st century AD rec.
Each epoch has a reference colour, set by double-clicking the epoch name and selecting a value in the Properties View panel at the bottom right.
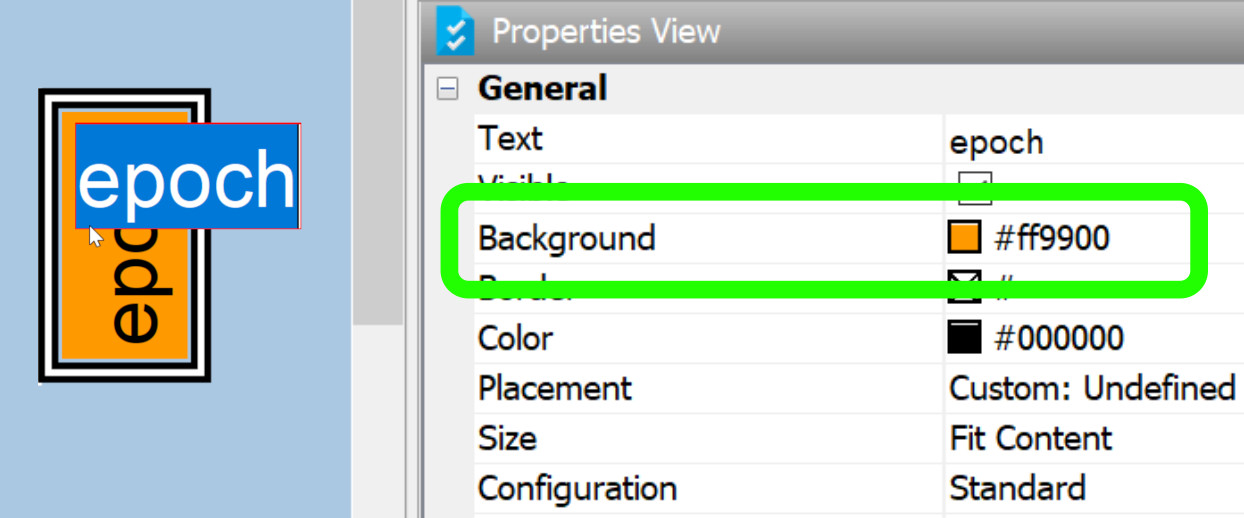
Fig. 2 Procedure for changing the colour of an epoch.
For the formal definition of the canvas and its components, see Canvas.
Step 2: insert stratigraphic units
At this point you can begin to insert the stratigraphic units (US) within the canvas. The procedure here again is drag & drop from the EM template. The symbol of a US is a white rectangle with a unique number inside (the US number).
Once a new US node has been inserted into the canvas, perform the following operations:
Rename the US by double-clicking on the node name.
Edit the description in the Properties View panel at the bottom right. The description must be short, functional to identify the quality or function of the element.
Connect the US with other existing units (if there are any) through an arc — a line with a terminal arrow connecting two nodes. Pre-select the arc type in the template by double-clicking it; among the available types, choose the continuous-line arc with a terminal arrow.

Fig. 3 Linking arcs between nodes. The continuous-line arc with terminal arrow is pre-selected here.
Important
By convention, the arrow always points to the older element (arrow pointing from the recent toward the past, i.e. top to bottom).
For the full vocabulary of node types see Stratigraphic Nodes and Auxiliary Stratigraphic nodes; for arcs and their semantics see Connectors.
Step 3: refine the matrix
If you have placed a US in the wrong epoch, you can select it and move it to another epoch by holding down SHIFT throughout the whole drag, and releasing the key only after the node has been dropped at its new position.
Where you can estimate the life-continuity of a US — i.e. the unit remained in use across several epochs — pick a continuity node from the template, place it in the end-of-life epoch, and connect it to the respective US.
Step 4: save the GraphML file
Once several US nodes are linked together, you have your first Extended
Matrix. Save the file in yEd’s default GraphML format inside the
EM subfolder of your project workspace — the same folder where the
collected sources live.
This .graphml file is the input you will feed to the downstream tools
of the EM ecosystem. The typical next step is the
EM Setup panel in EM Tools (Blender),
which loads the matrix and exposes the stratigraphic units for 3D modelling.
See also
EM workspace preparation — the folder layout the
.graphmlfile is expected to live in.Canvas, Stratigraphic Nodes, Connectors — the formal definitions behind every element you have just drawn.
Build the stratigraphic proxies in Blender — what to do, in EM Tools, once the matrix is drawn.