Paradata Manager and Graph Visualization
Todo
Embed YouTube video — placeholder slug 17_em_paradata_graphviz.
Once the recording is uploaded, replace this todo with a
.. raw:: html iframe pointing at the real YouTube video ID.
Working title: Paradata Manager and Graph Visualization (~~4 min).
Prerequisites
Overview
The Paradata Manager shows all qualia for a selected SU. Alt+F selects a 3D object and highlights it in the Stratigraphic Manager simultaneously. The experimental graph visualisation tool draws the full knowledge graph, enabling bidirectional navigation between graph nodes and 3D objects.
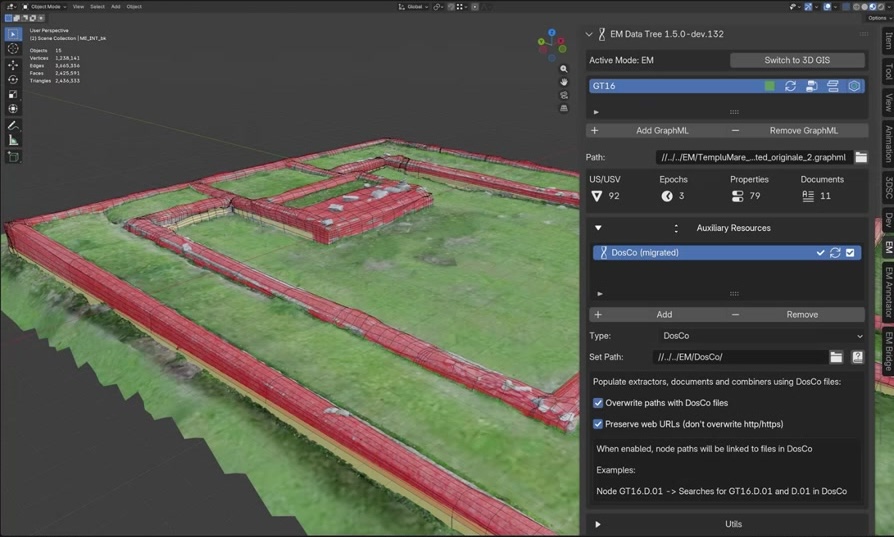
Fig. 35 Paradata Manager showing all properties for a selected SU.
Key Concepts
Alt+F: select a 3D object and locate it in the Stratigraphic Manager simultaneously.
Paradata Manager: lists all qualia, sources, and interpretations for the selected SU.
Graph visualisation: draws the full EM as an interactive diagram inside Blender.
Bidirectional: click a graph node to select the corresponding 3D object and vice versa.
Screenshots
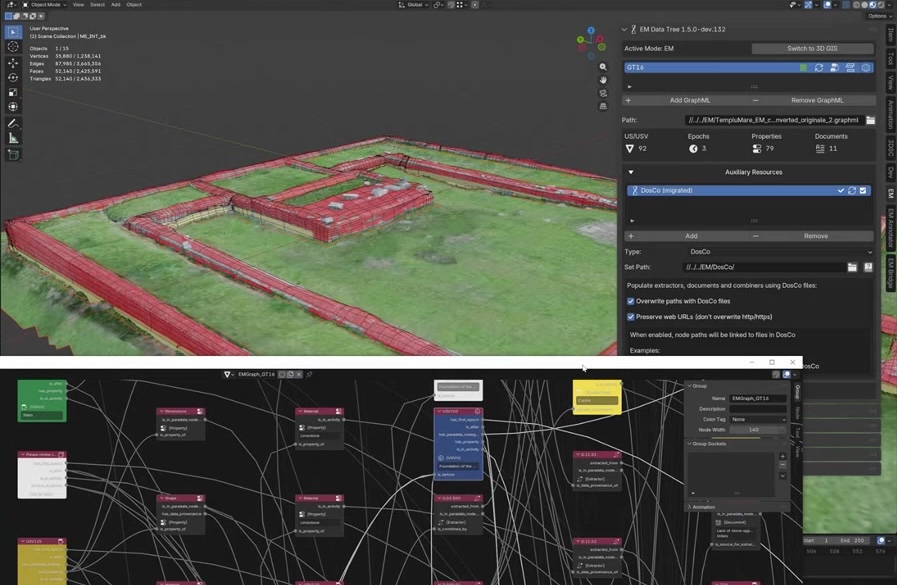
Fig. 36 Full knowledge graph drawn inside Blender via the visualisation tool.

Fig. 37 Bidirectional navigation: clicking a graph node selects the 3D object.
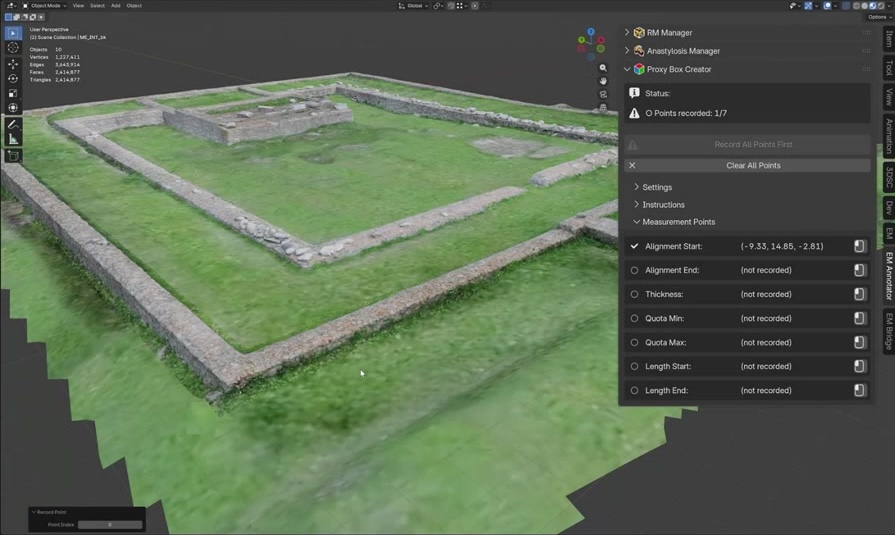
Fig. 38 The experimental warning banner on the graph visualisation tool.
Try It Yourself
Select three different objects in the Great Temple scene using Alt+F and compare their paradata in the Paradata Manager.
Note
A video walkthrough for this tutorial will be available on the Extended Matrix YouTube channel.